Ecommerce stores are drowning in data, but still flying blind
Storita connects your store data and surfaces the signals that matter - in real time.
Most stores lose money because of hidden inefficiencies when they don’t know what’s working, what’s not, and why.
Reports
Two different report systems for two different decisions.
Storita gives teams focused product intelligence when one page needs explanation, and recurring briefs that keep the whole store monitored over time.
Page readiness
Visual conversion review
Market position
Pricing and trust comparison
Checkout path
Browser-validated flow
Executive readout
One product can be reviewed from page clarity, market pressure, and checkout readiness in one linked analysis.
Screenshot report
Scores CTA visibility, pricing prominence, trust signals, and page clarity.
Competitor report
Compares pricing, trust, availability, and positioning across discovered competitors.
Purchase-flow test
Validates add-to-cart, cart persistence, checkout filling, and payment readiness.
Full audit
Synthesizes the child reports into one linked product-health summary.
Product intelligence
Focused analysis for one product, one page, or one checkout path.
Product intelligence opens the right analysis engine for the question at hand. It reviews a page visually, compares the offer against the market, validates the purchase flow in a real browser session, and combines those findings into one full audit.
Use this when one product or landing page needs a clear explanation before the team changes pricing, design, or merchandising.
Scheduled briefs
Daily, weekly, and monthly reviews that keep the store monitored.
These briefs turn store performance, traffic, customer behavior, and competitor movement into a rhythm the team can actually use. Each cadence answers a different decision horizon.
Daily brief
Every morningFlags what changed yesterday and the few issues worth fixing first.
Weekly brief
Every weekShows the pattern behind spend, conversion, and competitor movement.
Monthly brief
Every monthFrames direction, priorities, and category momentum for the next decisions.
Headline
Revenue held up, but two hero products need mobile conversion attention before noon.
Revenue
$18.9k
Conversion
2.9%
Priority
2 products
What lands in the brief
Recommended move
Review the two highest-traffic products with weaker mobile conversion before the next campaign push.
Cadence logic
Daily catches change, weekly shows the pattern, and monthly helps the team choose direction.
- Ask any question - get an answer instantly
- Always ready, no waiting
- Follow up naturally as new insights emerge
- Answers grounded in your store’s data
Chat with your store to get answers to any unclear issues.
Chat with Your Store
Chat with your store in plain language, follow the thread naturally, and get grounded answers that stay close to what is actually happening in the business. Storita also surfaces smart follow-ups so the next useful question is already in front of you.
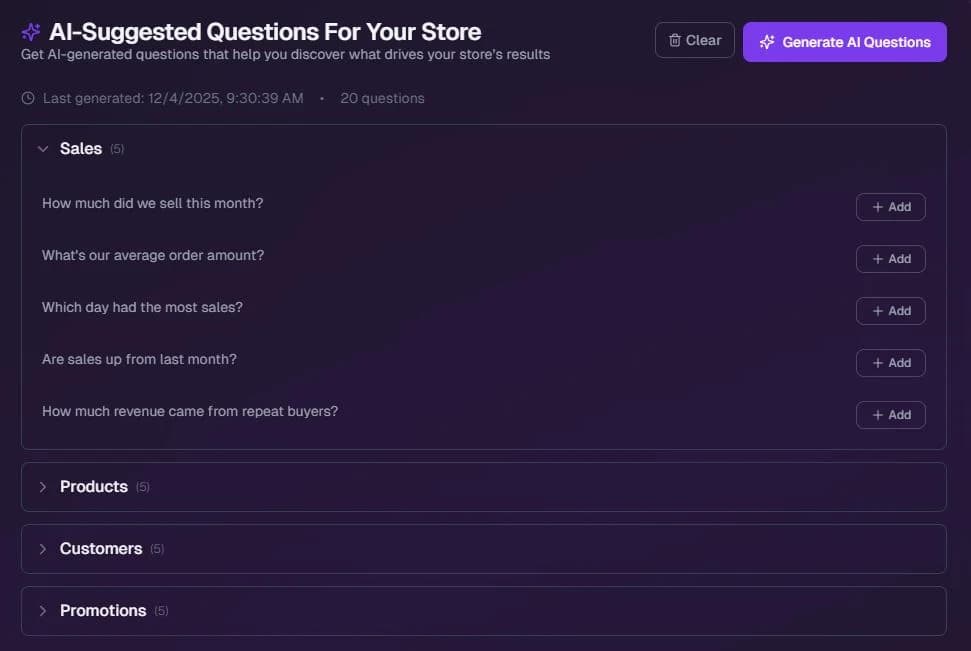
When You Don’t Know What to Ask
Storita uses AI to surface the questions your business needs answered.
Smart Questions
Smart Questions keep the investigation moving by bringing forward useful prompts based on your store context, performance patterns, and operational signals.
- Helps discover insights you didn’t know to look for
- Uncovers opportunities for safer, balanced growth
- Identifies seasonal trends before they happen
- Surfaces operational bottlenecks automatically

Instant Dashboards
Build your own real-time dashboard instantly. Add any chart from any answer with one click.
- Track only the metrics that matter to you
- Dashboards evolve as your business evolves
- Share charts with your team instantly
- Real-time data sync across all views
Built Around Store Efficiency
Storita is designed around store efficiency as a first-class concept. It looks at how products, inventory, pricing, and operations interact so growth stays balanced as the business scales.
Performance Scan
Get an instant diagnostic of your store's operational performance and find the leaks costing you profit.
Start NowOutcomes, Not Just Reports
Storita turns store signals into soft, data-driven recommendations your team can review and act on with context.
What Storita Continuously Analyzes
Efficiency = Profitability
Storita helps you see the weighting balance of your business:
- Which products waste time and money
- Where inventory is misallocated
- Which refunds silently kill profit
Continuous Measurement
Storita helps you see efficiency continuously across every season:
- Works in winter and summer
- High season and slow months
- Tracks how decisions impact profit over time
Data Sources
Six connectors. Every question answered.
Storita pulls live data from six sources. Ask anything about any of them — in plain language.
WooCommerce
Your core store — orders, products, revenue, refunds, and margins.
Google Ads
Paid search performance — campaigns, keywords, conversions, and ROAS.
Meta Ads
Facebook and Instagram ad performance — spend, reach, and purchases.
Google Analytics 4
Site traffic, user behavior, acquisition sources, and ecommerce conversions.
Google Search Console
Organic search visibility — keywords, rankings, clicks, and indexation.
Google Merchant Center
Shopping feed health — approvals, disapprovals, and price competitiveness.
"Identifying non-selling products required digging through reports, so it rarely happened. Now we see them immediately."